
Simulations and analyses in architectural design
Our company has prepared a number of analyses and simulations facilitating the design process for the Roark Studio and Arup Polska consortium, based on which a competition design was developed for a residential and service development complex at Kielecka St. in Gdynia.
Value Engineering
The competition project was developed in accordance with the principles of value engineering – creating the maximum possible value for the investor, residents, and the city, while minimizing costs.
At an urban level, the future value of flats has been maximized by not locating flats in the least favorable areas of the plot (along Kielecka St. – due to noise and northern exposure, and along the border with the shopping center – due to noise and view). A scenic analysis was carried out for the residential part with the aim of designing as many apartments with a sea view as possible. Care has also been taken to minimize unfavorable views: climbing greenery has been envisioned on the southern façades of the high-rise residential building and office buildings, introducing a hospitable atmosphere to the interior and restricting the view of the roof of the shopping center.
A further element was the introduction of added value, both for residential and office functions. A spacious, green patio with direct access to the forest, interconnecting all residential buildings, has been additionally screened from noise and unfavorable views. The mid-rise building and the high-rise building were connected by a number of auxiliary facilities.
The office buildings were connected with a glazed patio, where greenery and water were introduced, and eateries were situated. This space is intended to be semi-open – its task is to create a favorable microclimate, it is meant to be used all year round.

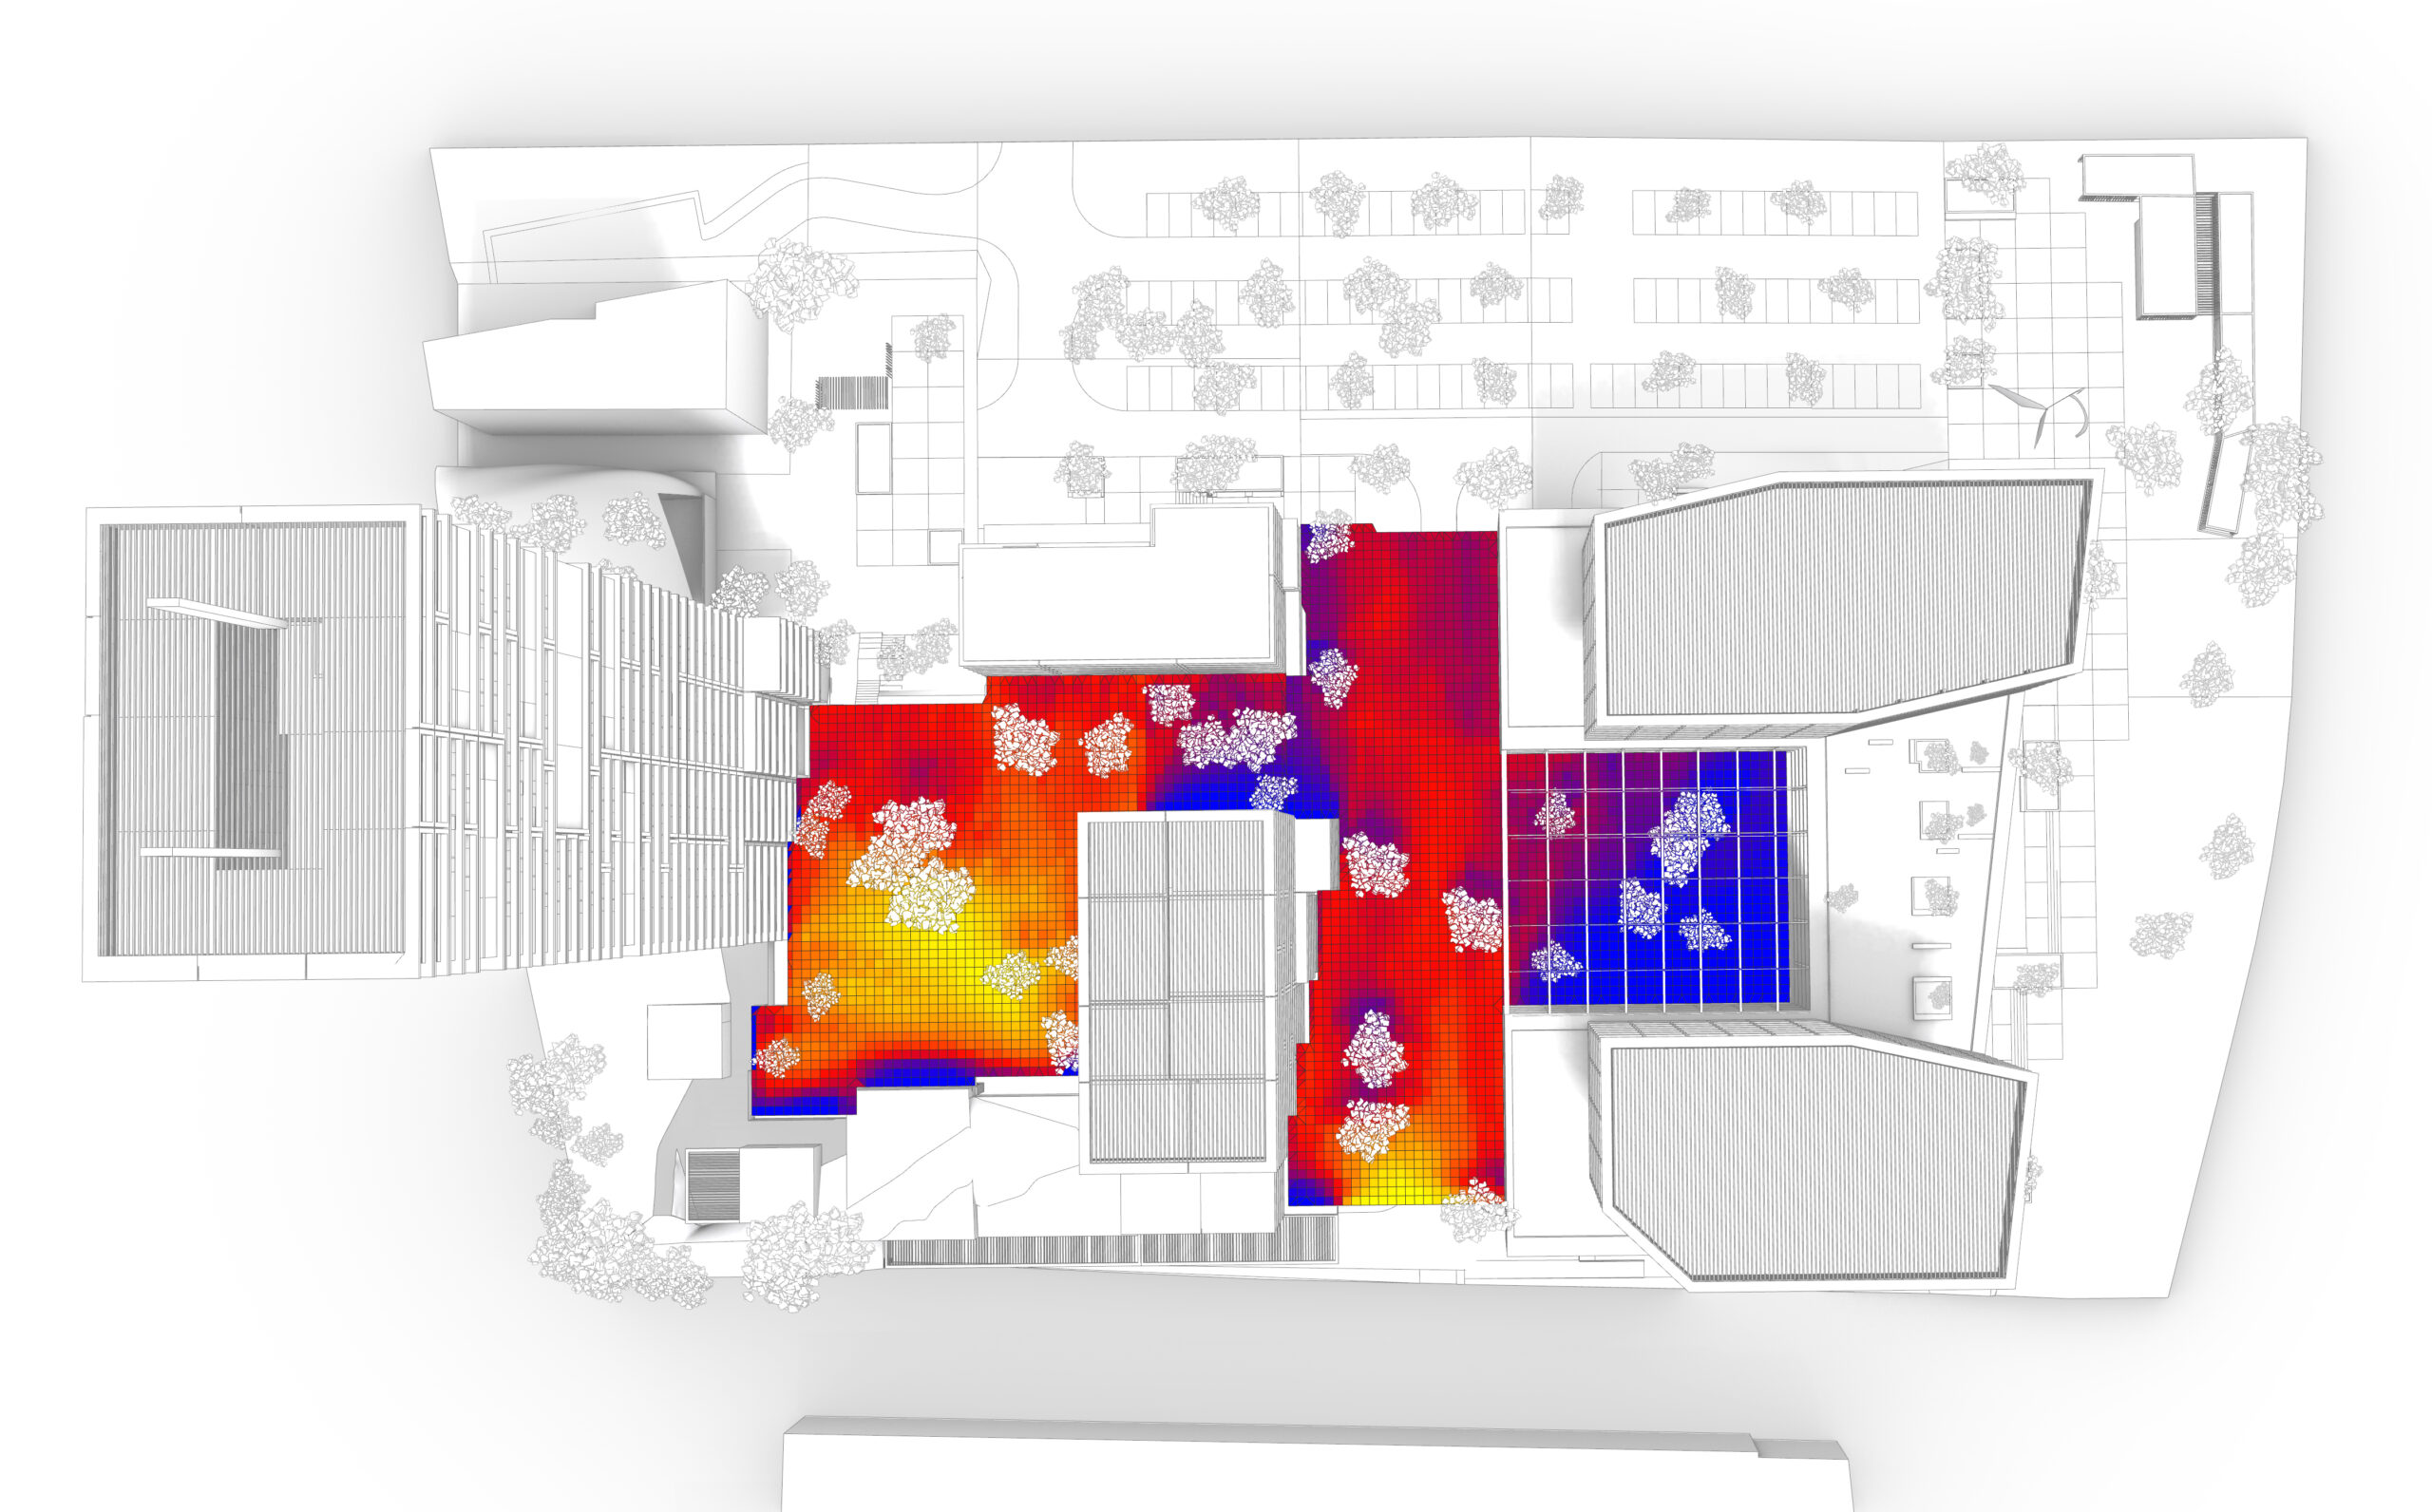
Direct Sunlight analysis
In order to ensure adequate sunlight in semi-public spaces, a simulation of daylight availability was carried out. The diagram above shows the average number of hours of incident light for the designed spaces.
A detailed insolation analysis was carried out for the days of the two equinoxes for the planned residential complex.


Daylight Factor analysis
Daylight Factor Analysis determining the ratio of outdoor light to light incident into rooms. The Daylight Factor is one of the factors defined by the BREEAM certification. For an office space, the mean value for the designed facility is 5.5%, satisfying the condition of 2% mandated by the certification.


Spatial Daylight Autonomy analysis
Daylight Autonomy Analysis determining the quality of daylight. Measured in lux for measurement points, the designed facility meets the requirement of 300 lux for a minimum of 2000 hours a year for 86% of the area. The BREEAM certification mandates that at least 80% of the space meets this condition.
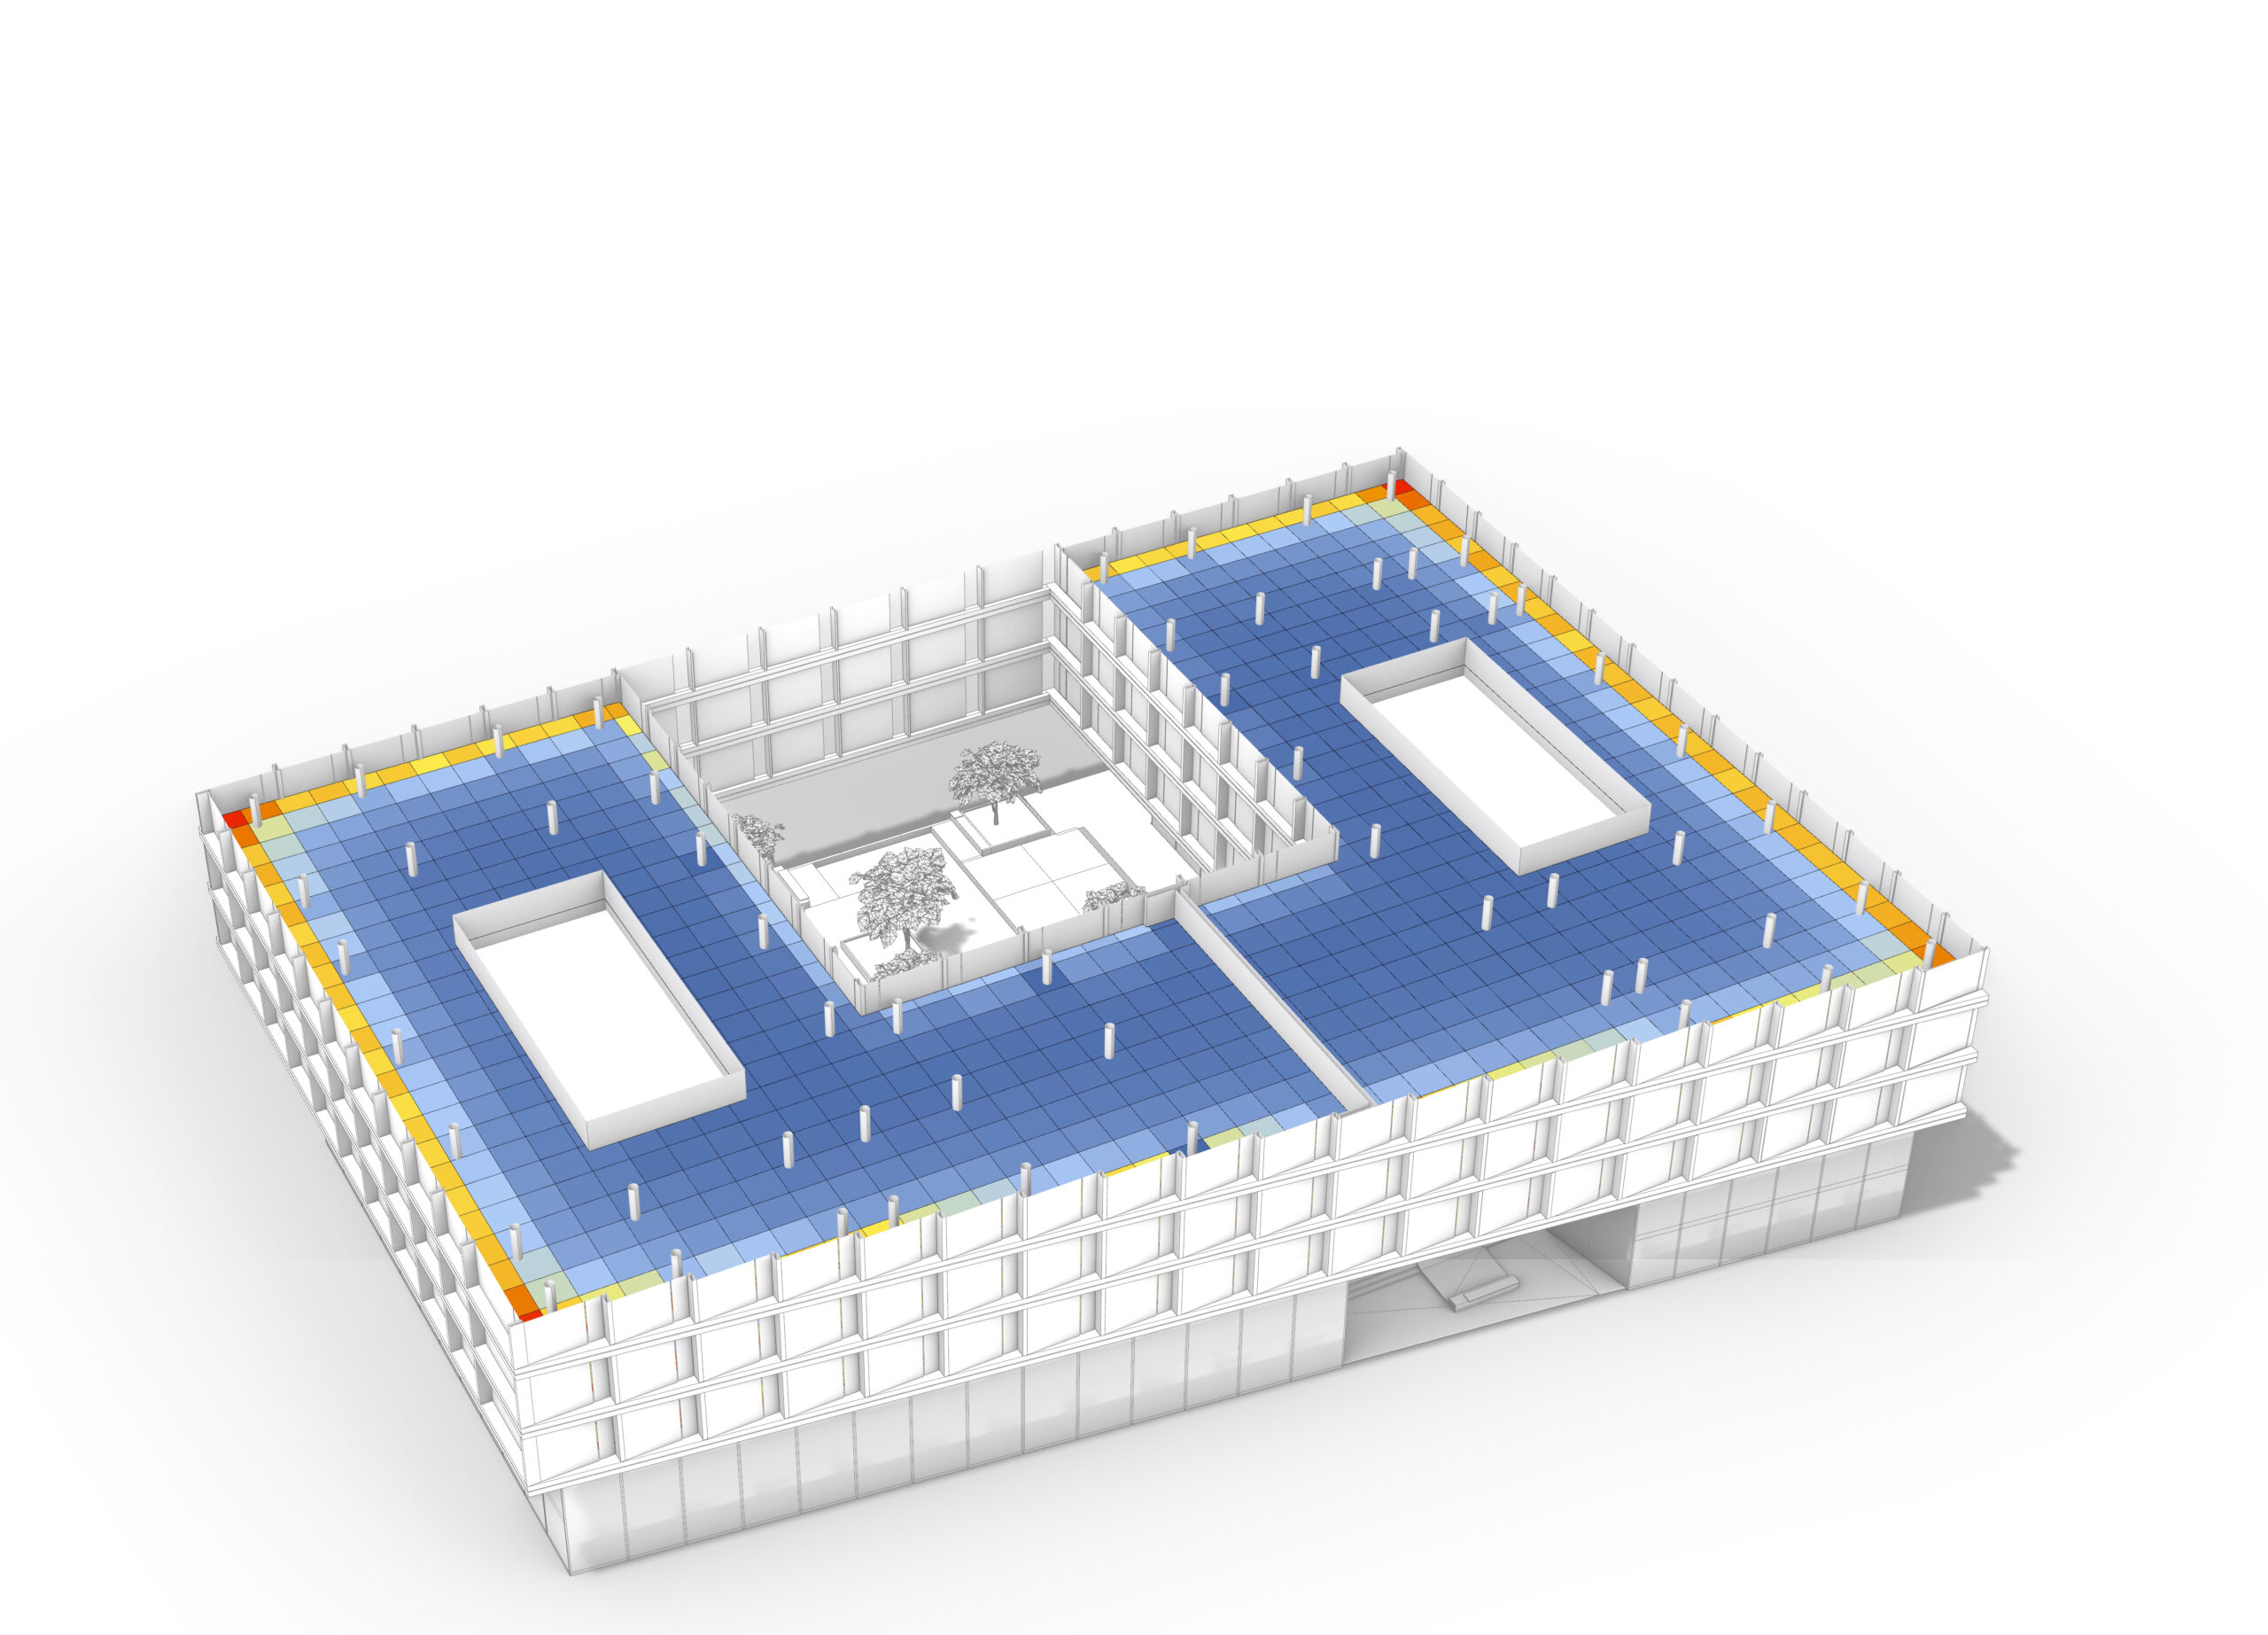
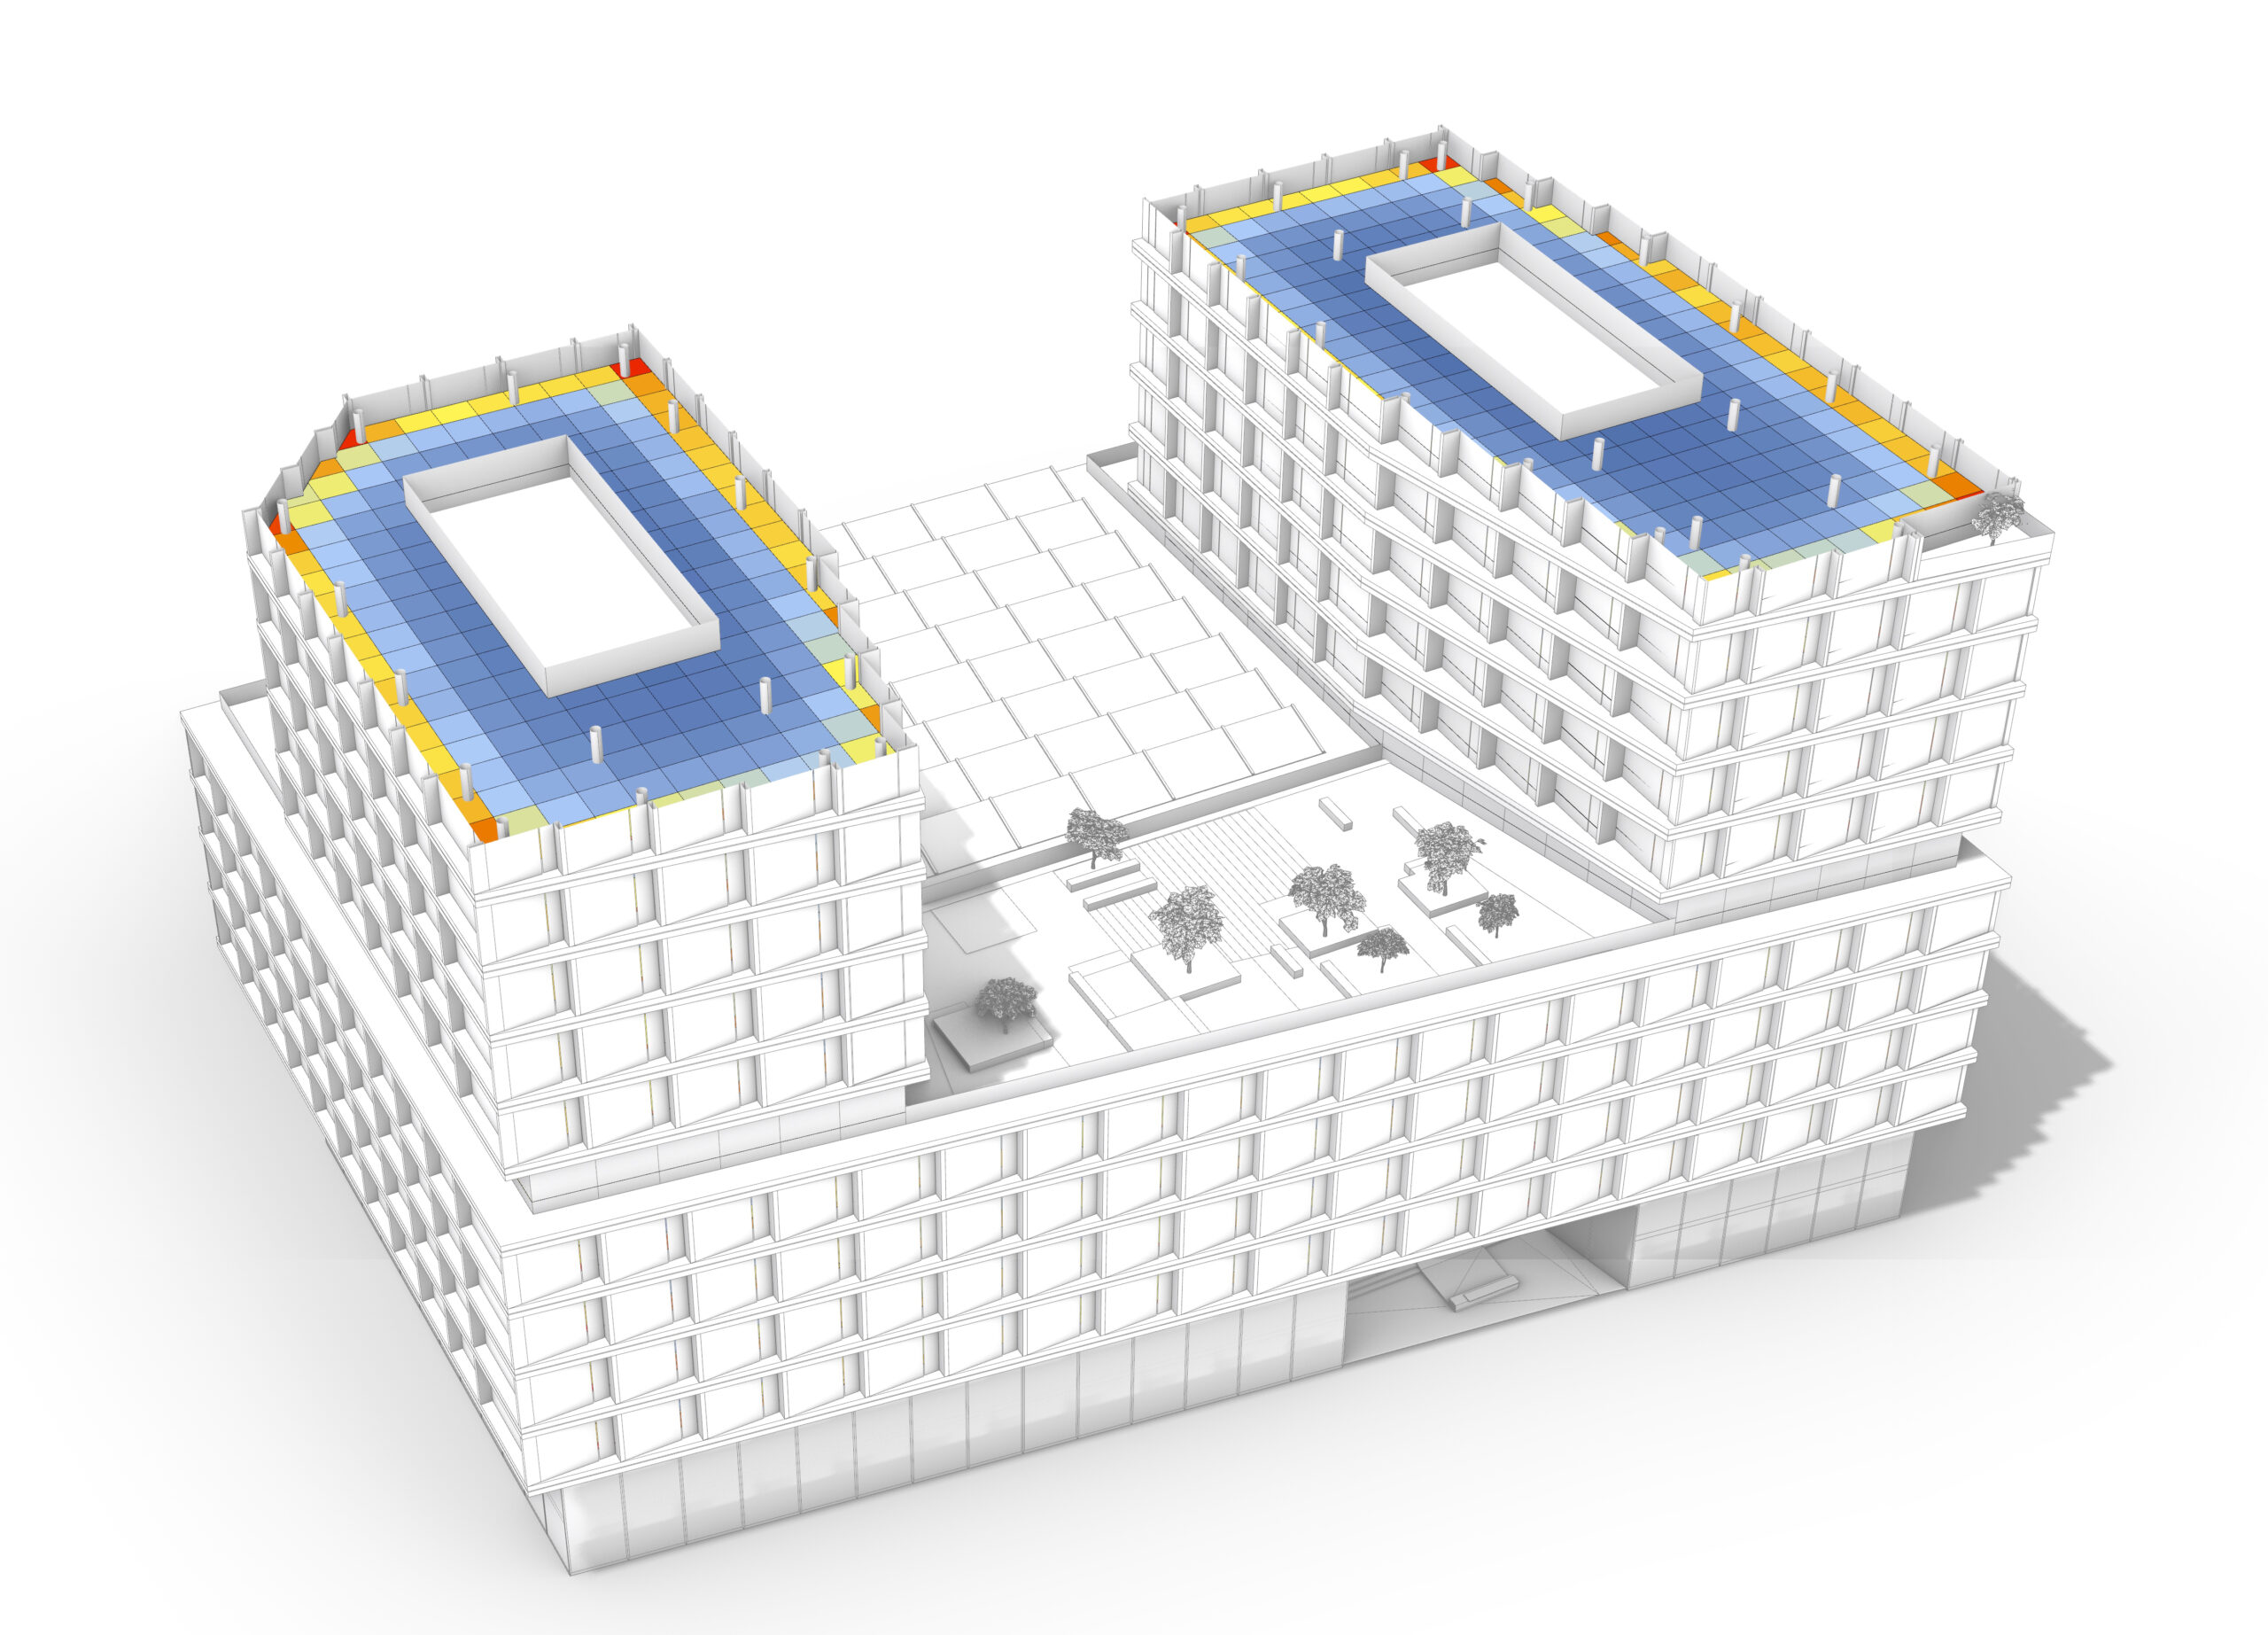

Analysis of heat gains from solar radiation
Analysis of heat gains from solar radiation. The bodies of the buildings have been situated and shaped to maximize solar energy gains. In order to avoid uncomfortable levels of insolation of the interior due to excess incident light, a system of vertical and horizontal panels has been used, effectively regulating light intensity.
.


Simulations of the impact of wind
Our design process employed simulations in a wind tunnel, which allowed to study the impact of wind on the comfort of users of semi-public spaces. An optimal location of buildings and the site development plan effectively regulate wind speed. The simulations we performed show a significant reduction in wind speed for semi-public spaces.


